

|

|

|

|

|
References
Contact Home |
|
This research page compiles known data associated with calibrated C-14 dates; either as
published or as calculated for this website using the CALIB 4.4 (or 5.0.2 as noted) program. (see http://www.calib.org ) * |
| INDEX: | |||
| NORTH COAST | NORTH HIGHLANDS | CENTRAL COAST | CENTRAL HIGHLANDS |
|
Huarpa settlements Conchopata |
|||
| SOUTH COAST | SOUTHWEST HIGHLANDS | SOUTHEAST HIGHLANDS | ALTIPLANO |
|
Pikillacta Pukacancha Tankarpata Peqokaypata |
Chucaripupata Kirawi Lukurmata Misiton I Misiton II Iwawi Akapana Akapana East 1M Akapana East 1 Putuni |
||
| FAR SOUTH COAST | FAR SOUTH HIGHLANDS | ||
|
Moquegua Caserones |
| GX-4048 B.P. 1713 ±120 Huari, northwest corner DATA DESCRIPTION: Five levels of Huarpa refuse was discovered from an exposed road cut to the southwest of Capilla Pata structure. Sample came from an ash lens in the middle of the third level. Levels 1 and 2 above contained ceramics that are stylistically consistent with those of the third level. Earliest dated Huarpa ceramics. No evidence of coastal Nasca contact. CALIB 7.1.0 RESULTS: 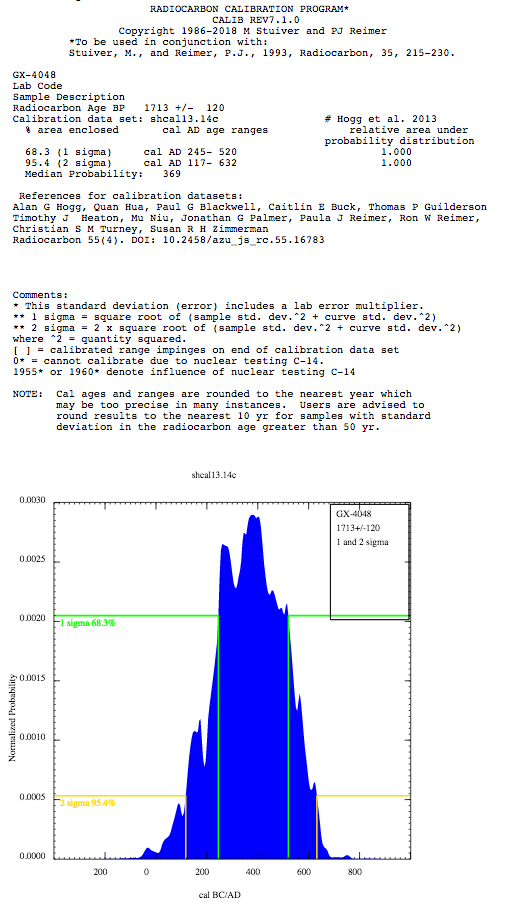
ARTIFACT ASSOCIATION: AN EARLY INTERMEDIATE PERIOD DEPOSIT OF HUARPA STYLE CERAMICS FROM THE SITE OF HUARI, DEPARTMENT OF AYACUCHO, PER⁄ B-133539 B.P. 1550 ± 40 Ketteman 2002:31-32, Table 5. DATA DESCRIPTION: Conchopata, Huarpa burial From undisturbed, sealed Huarpa burial below EA100 as organic sediment attached to body. See Ketteman 2002:Fig.17 for illustration of two Huarpa cup vessels associated with burial. These cups are not typical black-on-white; one displays the later, chevron band design and the other is more like the white Cruz Pata vessel shape with the rim top, loop handle; probably date prior to Epoch 1A. CALIB 5.0.2 RESULTS: PLOT GRAPH % area enclosed: relative area under probability distribution 68.3 (1 sigma) cal A.D. = 538 - 622 = 1.000 95.4 (2 sigma) cal A.D. = 434 - 491 = 0.140 cal A.D. = 508 - 519 = 0.018 cal A.D. = 527 - 647 = 0.841 ARTIFACT ASSOCIATION: N/A B-133543 B.P. 1420 ± 90 Ketteman 2002:34 DATA DESCRIPTION: Conchopata Charcoal samples from below the floor of Unit EA2 and therefore predates the construction of this room. From a secondary fill to level the surface. No illustrated ceramics. The room EA2 may date to anytime after 600 ad CALIB 5.0.2 RESULTS: PLOT GRAPH % area enclosed: relative area under probability distribution 68.3 (1 sigma) cal A.D. = 596 - 732 = 0.817 cal A.D. = 735 - 772 = 0.183 95.4 (2 sigma) cal A.D. = 443 - 451 = 0.004 cal A.D. = 462 - 484 = 0.011 cal A.D. = 532 - 888 = 0.985 ARTIFACT ASSOCIATION: N/A B-122695 B.P. 1280 ± 70 Isbell 2000:Fig.28; Ketteman 2002:31 DATA DESCRIPTION: Conchopata Sample from below floor in room (Unit EA124) about 10 m and 5 units to the east of Unit EA72, D-shaped structure excavated by Ochatoma and Cabrera (2002:Figs.8.6-11 (1997/98)) A secondary fill from subfloor stratum that predates construction of Unit 124 (Ketteman 2002:31) The room may date to anytime after 550 ad CALIB 5.0.2 RESULTS: PLOT GRAPH % area enclosed: relative area under probability distribution 68.3 (1 sigma) cal A.D. = 694- 701 = 0.036 cal A.D. = 707- 748 = 0.240 cal A.D. = 765- 884 = 0.725 95.4 (2 sigma) cal A.D. = 664 - 903 = 0.910 cal A.D. = 915- 968 = 0.090 ARTIFACT ASSOCIATION: N/A B-146400 B.P. 1380 ± 40 Isbell 2000:Fig.28; Ketteman 2002:44-46 DATA DESCRIPTION: Conchopata Unit EA6, under red clay floor. Wood charcoal within fill containing ceramic sherds. Associated with Pacheco style sherds (Isbell 2000: Fig.29-30; Bennett 1963[1944]:Fig.13a) and sherds from urns with the "Boat Warrior" icons (Isbell 2000: Fig.26 (2000D); Ochatoma and Cabrera 2000: Fig.8.5). Secondary fill deposit, possibly to level surface prior to room construction and therefore predates room but does not date ceramics in fill (Ketteman 2002:44). Since the general range is 650 - 750 ad, the floor construction can date anytime after 650 ad CALIB 5.0.2 RESULTS: PLOT GRAPH % area enclosed: relative area under probability distribution 68.3 (1 sigma) cal A.D. = 655 - 708 = 0.774 cal A.D. = 747 - 765 = 0.226 95.4 (2 sigma) cal A.D. = 641 - 777 = 1.000 ARTIFACT ASSOCIATION: N/A B-146401 B.P. 1300 ± 40 Ketteman 2002:46-47 DATA DESCRIPTION: Conchopata Wood charcoal sample from ash deposit in Unit EA106 that covers fancy decorated sherds from pits and may document a ceramic firing event or the sherds were deposited before the ash layer was created and were broken by the fire event (Ketteman 2002:46-47). No illustrated ceramics. CALIB 5.0.2 RESULTS: PLOT GRAPH % area enclosed: relative area under probability distribution 68.3 (1 sigma) cal A.D. = 688 - 782 = 0.764 cal A.D. = 789 - 812 = 0.167 cal A.D. = 846 - 856 = 0.069 95.4 (2 sigma) cal A.D. = 677 - 881 = 1.000 ARTIFACT ASSOCIATION: N/A B-146403 B.P. 1300 ± 70 Ketteman 2002:48-50 DATA DESCRIPTION: Conchopata Sample of charcoal pieces from a construction event under Unit EA93 (beneath the floor) and predates the construction. Earlier walls do not follow the orientation of EA93 walls. Sample from a secondary deposit of trash above the floors of the earlier structure and probably postdates the occupation of the earlier structure. (Ketteman 2002:48-49) No illustrated artifacts. The room EA93 may date anytime after 650 ad CALIB 5.0.2 RESULTS: PLOT GRAPH % area enclosed: relative area under probability distribution 68.3 (1 sigma) cal A.D. = 686 - 827 = 0.858 cal A.D. = 839 - 864 = 0.142 95.4 (2 sigma) cal A.D. = 655 - 900 = 0.950 cal A.D. = 918 - 954 = 0.046 cal A.D. = 957 - 961 = 0.004 ARTIFACT ASSOCIATION: N/A B-146402 B.P. 1270 ± 70 Ketteman 2002:47-48 DATA DESCRIPTION: Conchopata Sample of several charcoal pieces from a construction event under Unit EA79 and predates the construction. (Ketteman 2002:47-48). No illustrated artifacts. The room EA79 may date to anytime after 700 ad CALIB 5.0.2 RESULTS: PLOT GRAPH % area enclosed: relative area under probability distribution 68.3 (1 sigma) cal A.D. = 694 - 699 = 0.023 cal A.D. = 707 - 748 = 0.210 cal A.D. = 765 - 890 = 0.767 95.4 (2 sigma) cal A.D. = 669 - 905 = 0.883 cal A.D. = 912 - 971 = 0.117 ARTIFACT ASSOCIATION: N/A B-133546 B.P. 1270 ± 70 Isbell 2000:Fig.28; Isbell and Cook 2002:264-268; Ketteman 2002:37-38 DATA DESCRIPTION: Conchopata Unit EA100, D-shaped or circular structure. Large offering deposited in a pit that was disturbed by later destruction of the unit's wall in southeast area. Carbon sample from deepest stratum and may date pottery since offering vessels were mostly complete and represent primary deposition. Associated with large urns with bodiless, human profile heads. (Isbell and Cook 2002:Figs. 9.13-15 (1999B). This reference incorrectly published the date with ± 60 (Ketteman, personal communication, 2/23/2006)). Ketteman questions whether or not this sample from an ash deposit touching the ceramic deposit can be associated directly with the ofrenda or may predate it. (Ketteman 2002:37-38). Since the stratigraphic association is not explicit, then the sample does not date the pottery. CALIB 5.0.2 RESULTS: PLOT GRAPH % area enclosed: relative area under probability distribution 68.3 (1 sigma) cal A.D. = 694 - 699 = 0.023 cal A.D. = 707 - 748 = 0.210 cal A.D. = 765 - 890 = 0.767 95.4 (2 sigma) cal A.D. = 669 - 905 = 0.883 cal A.D. = 912 - 971 = 0.117 ARTIFACT ASSOCIATION: N/A B-146399 B.P. 1270 ± 40 Isbell 2000:Fig.28; Ketteman 2002:44 DATA DESCRIPTION: Conchopata Unit EA104T1, in a pit with 27 oversized face-necked jars (Isbell & Cook 2002:Figs. 9.18-19 (2000B)) of the fancy Chakipampa style probably middle Epoch 1B. This wood charcoal was deposited at same time as ceramics but is a secondary deposit of unknown origin and not a primary deposit of the pit. The sample does not date the "offering" ceramics. CALIB 5.0.2 RESULTS: PLOT GRAPH % area enclosed: relative area under probability distribution 68.3 (1 sigma) cal A.D. = 730 - 736 = 0.040 cal A.D. = 772 - 882 = 0.960 95.4 (2 sigma) cal A.D. = 685 - 895 = 0.987 cal A.D. = 926 - 935 = 0.013 ARTIFACT ASSOCIATION: N/A B-133550 B.P. 1250 ± 60 Isbell 2000:Fig.28; Ketteman 2002:41-42 DATA DESCRIPTION: Conchopata Unit EA36, surface of the room associated with oversized face-neck jar (Isbell & Cook 2002:Fig. 9.17 (1999C)). Epoch 2 Viñaque avian head motif on jar (see Bennett 1953:Plate 6E; Menzel 1964:ftnt. 236). Charcoal sample is from secondary context and mixed with ceramic ofrenda; therefore no clear stratigraphic association and does not date the pottery (Ketteman 2002:42). (Note: this date was published incorrectly in Ketteman 2002:64 Table 5 as 1230 ± 60 (Ketteman, personal communication, 2/23/2006)). CALIB 5.0.2 RESULTS: PLOT GRAPH % area enclosed: relative area under probability distribution 68.3 (1 sigma) cal A.D. = 722 - 740 = 0.082 cal A.D. = 770 - 896 = 0.854 cal A.D. = 924 - 938 = 0.063 95.4 (2 sigma) cal A.D. = 687 - 973 = 1.000 ARTIFACT ASSOCIATION: N/A B-133542 B.P. 1210 ± 60 Ketteman 2002:33-34 DATA DESCRIPTION: Conchopata Ketteman combines this sample with B133541 for interpretation. Completely burned branches from pits in Unit EA33, D-shaped structure that date the termination of occupation before unit was buried by 1 m of secondary deposits. Most branches found unbroken and therefore date to last use of room prior to burial and construction of rectangular units above. Rooms above may date anytime after 800 ad CALIB 5.0.2 RESULTS: PLOT GRAPH % area enclosed: relative area under probability distribution 68.3 (1 sigma) cal A.D. = 782 - 790 = 0.048 cal A.D. = 810 - 903 = 0.597 cal A.D. = 915 - 969 = 0.355 95.4 (2 sigma) cal A.D. = 694 - 701 = 0.006 cal A.D. = 707 - 748 = 0.054 cal A.D. = 765 - 994 = 0.940 ARTIFACT ASSOCIATION: N/A B-146398 B.P. 1170 ± 60 Isbell 2000:Fig.28; Ketteman 2002:43 DATA DESCRIPTION: Conchopata Unit EA98, on floor of large patio associated with an almost complete oversized urn (Isbell & Cook 2002:Fig.9.22 (2001A)). Due to stylistic similarities, oversized urns from Unit EA78 are probably contemporary (Isbell & Cook 2002:Fig.9.20). Charcoal sample from burned roof collapse and predates the placement of urn in room and age of wood may slightly predate room construction. Due to poor preservation of wood in highlands, the carbon date should represent the age of the wood soon after being cut and then preserved by roof construction of the room and then preserved by carbonization and burial under roof debris (Ketteman 2002:33, ftnt. 2). Also urn could have been made earlier before placement in room. CALIB 5.0.2 RESULTS: PLOT GRAPH % area enclosed: relative area under probability distribution 68.3 (1 sigma) cal A.D. = 833 - 835 = 0.008 cal A.D. = 868 - 994 = 0.992 95.4 (2 sigma) cal A.D. = 775 - 1024 = 1.000 ARTIFACT ASSOCIATION: N/A B-133541 B.P. 1180 ± 60 Ketteman 2002:33-34 DATA DESCRIPTION: Conchopata Ketteman combines this sample with B133542 for interpretation. Completely burned branches from pits in Unit EA33, D-shaped structure that date the termination of occupation before unit was buried by 1 m of secondary deposits. Most branches found unbroken and therefore date to last use of room prior to its burial and construction of rectangular units above. Rooms above may date anytime after 800 ad CALIB 5.0.2 RESULTS: PLOT GRAPH % area enclosed: relative area under probability distribution 68.3 (1 sigma) cal A.D. = 784 - 786 = 0.009 cal A.D. = 828 - 838 = 0.042 cal A.D. = 865 - 989 = 0.949 95.4 (2 sigma) cal A.D. = 732 - 735 = 0.002 cal A.D. = 772 - 1023 = 0.998 ARTIFACT ASSOCIATION: N/A B-133544 B.P. 1100 ± 60 Isbell 2000:Fig.28; Ketteman 2002:34-36 DATA DESCRIPTION: Conchopata Unit EA4 and EA2 with sherds scattered across surfaces of both rooms (Isbell & Cook 2002:Figs.9.9-12) Representative of Tello (1942) ofrenda style considered by Menzel as Epoch 1A, but by Knobloch as late Epoch 1B or early Epoch 2. This charcoal sample came from pit in floor covered by the offering pottery. It postdates the construction of EA2 and 4, "most likely associated with their abandonment" and either predates or is contemporary with the offering pottery (Ketteman 2002:35-36). However, as a secondary deposit the charcoal could be older than room; therefore, the sample can not be used to date the room or the pottery. CALIB 5.0.2 RESULTS: PLOT GRAPH % area enclosed: relative area under probability distribution 68.3 (1 sigma) cal A.D. = 897 - 923 = 0.178 cal A.D. = 940 - 1034 = 0.822 95.4 (2 sigma) cal A.D. = 875 - 1151 = 1.000 ARTIFACT ASSOCIATION: N/A B-133547 B.P. 1040 ± 60 Ketteman 2002:38-39 DATA DESCRIPTION: Conchopata Sample of twisted plant material made for burial's mummy bindings. Disturbed cist tomb in Unit EA38B. No illustrated ceramics from burial. The burial dates to anytime after 950 ad CALIB 5.0.2 RESULTS: PLOT GRAPH % area enclosed: relative area under probability distribution 68.3 (1 sigma) cal A.D. = 992 - 1049 = 0.488 cal A.D. = 1080 - 1143 = 0.512 95.4 (2 sigma) cal A.D. = 899 - 919 = 0.023 cal A.D. = 953 - 956 = 0.002 cal A.D. = 961 - 1184 = 0.975 ARTIFACT ASSOCIATION: N/A B-133545 B.P. 1030 ± 50 Ketteman 2002:36-37 DATA DESCRIPTION: Conchopata Carbon sample of small burned twigs from a poorly defined floor in Unit EA61. Associated with trash left on floor in a secondary context and may date the abandonment of the room; perhaps roof collapse debris (Ketteman 2002:36-37). Associated with oversize urn fragments, no illustrations except in situ photo (IBID:Fig. 16). This secondary deposit can not date the room. CALIB 5.0.2 RESULTS: PLOT GRAPH % area enclosed: relative area under probability distribution 68.3 (1 sigma) cal A.D. = 999 - 1002 = 0.014 cal A.D. = 1016 - 1050 = 0.352 cal A.D. = 1079 - 1145 = 0.634 95.4 (2 sigma) cal A.D. = 984 - 1176 = 1.000 ARTIFACT ASSOCIATION: N/A B-133548 B.P. 1120 ± 60 Ketteman 2002:39-40 DATA DESCRIPTION: Conchopata Vegetable sample from intact, flexed burial (1999:#9) beneath the floor of Unit EA31 ("Mortuary Complex"), that showed reuse due to a disturbed pile of bones from earlier burial (s). Ketteman further suggests that the sample dates the associated burial but only 'possibly' dates use of room above and pottery found in burial (that may be from earlier burial event). No illustrated ceramics. The room EA31 dates to anytime after A.D.1050. (Note: this date was published incorrectly in Ketteman 2002:64 Table 5 as 980 ± 50 (Ketteman, personal communication, 2/23/2006)). CALIB 5.0.2 RESULTS: PLOT GRAPH % area enclosed: relative area under probability distribution 68.3 (1 sigma) cal A.D. = 896 - 923 = 0.228 cal A.D. = 939 - 1023 = 0.772 95.4 (2 sigma) cal A.D. = 782 - 789 = 0.005 cal A.D. = 811 - 847 = 0.031 cal A.D. = 856 - 1048 = 0.899 cal A.D. = 1082 - 1140 = 0.065 ARTIFACT ASSOCIATION: N/A |
| B-43230 B.P. 1150 ± 80 McEwan 1991:111-112; Glowacki 2005:Table 7.1 DATA DESCRIPTION: Pikillacta Sector 2, Unit 36, architectural carbon sample associated with plaster floor. Associated with Wari style ceramics, not illustrated. CALIB 5.0.2 RESULTS: PLOT GRAPH % area enclosed: relative area under probability distribution 68.3 (1 sigma) cal A.D. = 784 - 786 = 0.003 cal A.D. = 829 - 838 = 0.031 cal A.D. = 865 - 1024 = 0.966 95.4 (2 sigma) cal A.D. = 715 - 744 = 0.021 cal A.D. = 768 - 1049 = 0.924 cal A.D. = 1080 - 1143 = 0.055 ARTIFACT ASSOCIATION: N/A B-43231 B.P. 1290 ± 60 McEwan 1991:111-112; Glowacki 2005:Table 7.1 DATA DESCRIPTION: Pikillacta Sector 2, Unit 43A3, architectural carbon sample from lintel of in situ doorway. Associated with Wari style ceramics, not illustrated. CALIB 5.0.2 RESULTS: PLOT GRAPH % area enclosed: relative area under probability distribution 68.3 (1 sigma) cal A.D. = 694 - 702 = 0.053 cal A.D. = 706 - 748 = 0.279 cal A.D. = 764 - 869 = 0.668 95.4 (2 sigma) cal A.D. = 662 - 898 = 0.967 cal A.D. = 920 - 945 = 0.033 ARTIFACT ASSOCIATION: N/A B-43232 B.P. 1180 ± 60 McEwan 1991:111-112; Glowacki 2005:Table 7.1 DATA DESCRIPTION: Pikillacta Sector 2, Unit 37B2, architectural carbon sample of burned upper floor support. Associated with Wari style ceramics, not illustrated. CALIB 5.0.2 RESULTS: PLOT GRAPH % area enclosed: relative area under probability distribution 68.3 (1 sigma) cal A.D. = 784 - 786 = 0.009 cal A.D. = 828 - 838 = 0.042 cal A.D. = 865 - 989 = 0.949 95.4 (2 sigma) cal A.D. = 732 - 735 = 0.002 cal A.D. = 772 - 1023 = 0.998 ARTIFACT ASSOCIATION: N/A B-43233 B.P. 1060 ± 50 McEwan 1991:111-112; Glowacki 2005:Table 7.1 DATA DESCRIPTION: Pikillacta Sector 2, Unit 43A3, architectural carbon sample of burned upper floor support. CALIB 5.0.2 RESULTS: PLOT GRAPH % area enclosed: relative area under probability distribution 68.3 (1 sigma) cal A.D. = 986 - 1046 = 0.694 cal A.D. = 1085 - 1111 = 0.202 cal A.D. = 1117 - 131 = 0.104 95.4 (2 sigma) cal A.D. = 899 - 919 = 0.034 cal A.D. = 952 - 955 = 0.004 cal A.D. = 961 - 1155 = 0.962 ARTIFACT ASSOCIATION: N/A B-43234 B.P. 1330 ± 60 McEwan 1991:111-112; Glowacki 2005:Table 7.1 DATA DESCRIPTION: Pikillacta Sector 2, Unit 37B2, architectural carbon sample from upper floor support on floor below. Associated with Wari style ceramics, not illustrated. CALIB 5.0.2 RESULTS: PLOT GRAPH % area enclosed: relative area under probability distribution 68.3 (1 sigma) cal A.D. = 665 - 780 = 0.926 cal A.D. = 792 - 805 = 0.074 95.4 (2 sigma) cal A.D. = 653 - 886 = 1.000 ARTIFACT ASSOCIATION: N/A TX-3996 B.P. 1100 ± 60 McEwan 1991:111-112; Glowacki 2005:Table 7.1 DATA DESCRIPTION: Pikillacta Sector 4, Unit 12, braided vine (Pispita) for interior wall construction. (Same vine as Tx-4247) CALIB 5.0.2 RESULTS: PLOT GRAPH % area enclosed: relative area under probability distribution 68.3 (1 sigma) cal A.D. = 897 - 923 = 0.178 cal A.D. = 940 - 1034 = 0.822 95.4 (2 sigma) cal A.D. = 875 - 1151 = 1.000 ARTIFACT ASSOCIATION: N/A Tx-4247 B.P. 1140 ± 60 McEwan 1991:111-112; Glowacki 2005:Table 7.1 DATA DESCRIPTION: Pikillacta Sector 4, Unit 12, braided vine (Pispita) for interior wall construction. (Same vine as Tx-3996) CALIB 5.0.2 RESULTS: PLOT GRAPH % area enclosed: relative area under probability distribution 68.3 (1 sigma) cal A.D. = 894 - 997 = 0.920 cal A.D. = 1005 - 1016 = 0.080 95.4 (2 sigma) cal A.D. = 778 - 1042 = 0.996 cal A.D. = 1092 - 1099 = 0.004 ARTIFACT ASSOCIATION: N/A Tx-4750 B.P. 1350 ± 60 McEwan 1991:111-112; Glowacki 2005:Table 7.1 DATA DESCRIPTION: Pikillacta Canchon 2, carbon from midden in Unit 19, lowest levels. Associated with Ocros style ceramics. CALIB 5.0.2 RESULTS: PLOT GRAPH % area enclosed: relative area under probability distribution 68.3 (1 sigma) cal A.D. = 661 - 775 = 1.000 95.4 (2 sigma) cal A.D. = 646 - 880 = 1.000 ARTIFACT ASSOCIATION: McEwan 1991:Figure 30 Tx-4751 B.P. 1430 ± 90 McEwan 1991:111-112; Glowacki 2005:Table 7.1 DATA DESCRIPTION: Pikillacta Sector 2, Unit 16 B-D, structure 12-2A, carbon on plaster floor. CALIB 5.0.2 RESULTS: PLOT GRAPH % area enclosed: relative area under probability distribution 68.3 (1 sigma) cal A.D. = 577 - 721 = 0.863 cal A.D. = 741 - 770 = 0.137 95.4 (2 sigma) cal A.D. = 440 - 485 = 0.028 cal A.D. = 532 - 882 = 0.972 ARTIFACT ASSOCIATION: N/A BACK TO TOP Pukacancha C-14 CHART DATA DESCRIPTION: Pukacancha Unit 1, lowest level of trash pit. Wood carbon sample. Associated with bichrome Qotakalli ceramics. (no illust.) CALIB RESULTS N/A ARTIFACT ASSOCIATION: N/A AA-34935 Bauer and Jones 2003:8-9 (Fig.11) DATA DESCRIPTION: Pukacancha Unit 2, beneath Inca floor. Wood carbon Associated with Arahuay and Wari Huamanga ceramics. CALIB RESULTS N/A ARTIFACT ASSOCIATION: Fig. 11 AA-34937 Bauer and Jones 2003:8-9 DATA DESCRIPTION: Pukacancha Unit 6, abandonment of site. Ash & carbon lens below Inca floor. Associated with Arahuay and Qotakalli ceramics. (no illust.) CALIB RESULTS N/A ARTIFACT ASSOCIATION: N/A AA-39791 Bauer and Jones 2003:8-9 DATA DESCRIPTION: Pukacancha Unit 1, deposit. Wood carbon. Associated with black-on-cream Qotakalli and Arahuay ceramics. CALIB RESULTS N/A ARTIFACT ASSOCIATION: N/A AA-39793 Bauer and Jones 2003:8-9 (Fig. 10) DATA DESCRIPTION: Pukacancha Unit 1, one of the levels. Wood carbon. Associated with black-on-cream Qotakalli, Arahuay and Incised Black Ware ceramics. CALIB RESULTS N/A ARTIFACT ASSOCIATION: N/A Tankarpata C-14 CHART DATA DESCRIPTION: Tankarpata Unit 13, shallow pit. Wood carbon. Associated with Arahuay, Wari ViÒaque, Qotakalli ceramics CALIB RESULTS N/A ARTIFACT ASSOCIATION: Fig. 15 AA-34939 Bauer and Jones 2003:10 DATA DESCRIPTION: Tankarpata Unit 4, disturbed area. CALIB RESULTS N/A ARTIFACT ASSOCIATION: N/A AA-34941 Bauer and Jones 2003:10 DATA DESCRIPTION: Tankarpata Unit 4, disturbed area. CALIB RESULTS N/A ARTIFACT ASSOCIATION: N/A AA-39785 Bauer and Jones 2003:10 DATA DESCRIPTION: Tankarpata Unit 4, approx. 75 cm depth. Wood carbon. Associated with pure Qotakalli black-on -cream and black-and-red-on-cream ceramics. CALIB RESULTS N/A ARTIFACT ASSOCIATION: N/A AA-39786 Bauer and Jones 2003:10 (Figs. 13 and 14) DATA DESCRIPTION: Tankarpata Unit 3, shallow pit. Wood carbon. Associated with Arahuay and black-on-cream Qotakalli ceramics CALIB RESULTS N/A ARTIFACT ASSOCIATION: Figs. 13 and 14 BACK TO TOP AA-39787 Bauer and Jones 2003:10 DATA DESCRIPTION: Tankarpata Unit 4, near bottom, approx. 1.4 m depth. Wood carbon. Associated with pure Qotakalli black-on -cream and black-and-red-on-cream ceramics. CALIB RESULTS N/A ARTIFACT ASSOCIATION: N/A AA-39788 Bauer and Jones 2003:10 DATA DESCRIPTION: Tankarpata Unit 2, floor level. Wood carbon. Associated with Arahuay ceramics. CALIB RESULTS N/A ARTIFACT ASSOCIATION: N/A AA-39789 Bauer and Jones 2003:10 DATA DESCRIPTION: Tankarpata Unit 7, trash pit. Lower level bone. Associated with black-on-cream Qotakalli ceramics. CALIB RESULTS N/A ARTIFACT ASSOCIATION: N/A AA-39790 Bauer and Jones 2003:10 DATA DESCRIPTION: Tankarpata Unit 7, trash pit. Higher level bone. Associated with black-on-cream Qotakalli ceramics. CALIB RESULTS N/A ARTIFACT ASSOCIATION: N/A Peqokaypata C-14 CHART AA-34931 Bauer and Jones 2003:12-13 DATA DESCRIPTION: Peqokaypata Unit 7 pit intrusion in Chanapata-derived-bearing deposits. Wood carbon. Unknown, transitional style ceramics to mark beginning of the Early Intermediate Period occupation. CALIB RESULTS N/A ARTIFACT ASSOCIATION: N/A AA-39781 Bauer and Jones 2003:12-13 DATA DESCRIPTION: Peqokaypata Unit 12, second phase occupation. Wood carbon. Associated with Qotakalli ceramics. CALIB RESULTS N/A ARTIFACT ASSOCIATION: N/A AA-39783 Bauer and Jones 2003:12-13 DATA DESCRIPTION: Peqokaypata Unit 12, second phase occupation. Wood carbon. Associated with Qotakalli ceramics. CALIB RESULTS N/A ARTIFACT ASSOCIATION: N/A AA-39784 Bauer and Jones 2003:12-13 DATA DESCRIPTION: Peqokaypata Unit 12, surface of a platform. Wood carbon. Associated with incised incensario sherds, Qotakalli and Muyu Orco ceramics. CALIB RESULTS N/A ARTIFACT ASSOCIATION: N/A McEwan 1991:111-112 DATA DESCRIPTION: Pikillacta Unit 19, lowest levels. Carbon. CALIB RESULTS N/A ARTIFACT ASSOCIATION: N/A BACK TO TOP |
| DATA DESCRIPTION: Chucaripupata, Island of the Sun F.25 trash pit of earliest occupation in Block B; burned organic sample from interior of olla Associated with Tiwanaku IV ceramics including 2 blackware keros, 1 red slip kero and 1 blackware tazon (Seddon 2004:Fig.5.25-26; 1998:Fig.4.40, 4.13) CALIB 5.0.2 RESULTS: PLOT GRAPH % area enclosed: relative area under probability distribution 68.3 (1 sigma) cal A.D. = 624 - 627 = 0.022 cal A.D. = 632 - 687 = 0.978 95.4 (2 sigma) cal A.D. = 600 - 720 = 0.911 cal A.D. = 742 - 769 = 0.089 ARTIFACT ASSOCIATION: (Seddon 2004:Fig.5.25; 1998:Fig.4.40) ARTIFACT ASSOCIATION: (Seddon 2004:Fig.5.26; 1998:Fig.4.13) OS-12678 B.P. 1370 ± 35 Seddon 2004:Table 5.1; 1998:Table A.1 DATA DESCRIPTION: Chucaripupata, Island of the Sun Charcoal sample from fill covering the earliest occupation, including Feature 25. Though many illustrations of Tiwanaku IV ceramics, none are directly associated with this sample CALIB 5.0.2 RESULTS: PLOT GRAPH % area enclosed: relative area under probability distribution 68.3 (1 sigma) cal A.D. = 660 - 709 = 0.737 cal A.D. = 747 - 766 = 0.263 95.4 (2 sigma) cal A.D. = 652 - 773 = 1.000 ARTIFACT ASSOCIATION: N/A OS-12676 B.P. 1310 ± 40 Seddon 2004:Table 5.1; 1998:Table A.1 DATA DESCRIPTION: Chucaripupata, Island of the Sun F.22 pit cut by house (F.20), therefore predates OS12675 Earliest occupation (F.25) covered with sterile sand and house (F.20) built on top. Associated with Tiwanaku V ceramics. (Seddon 1998:Fig.5.25) CALIB 5.0.2 RESULTS: PLOT GRAPH % area enclosed: relative area under probability distribution 68.3 (1 sigma) cal A.D. = 682 - 781 = 0.902 cal A.D. = 791 - 807 = 0.098 95.4 (2 sigma) cal A.D. = 671 - 874 = 1.000 ARTIFACT ASSOCIATION: Seddon 1998:Fig.5.25 OS-12675 B.P. 1140 ± 35 Seddon 2004:Table 5.1; 1998:Table A.1 DATA DESCRIPTION: Chucaripupata, Island of the Sun Carbon sample from roof material when house burned. A midden formed on top of the roof material. Seddon (1998) provides Tiwanaku V ceramic illustrations for "floor fill context" (Fig.5.33), "collapse context" (Fig. 5.35), and "fill over context" (Fig. 5.37). CALIB 5.0.2 RESULTS: PLOT GRAPH % area enclosed: relative area under probability distribution 68.3 (1 sigma) cal A.D. = 898 - 921 = 0.323 cal A.D. = 943 - 991 = 0.677 95.4 (2 sigma) cal A.D. = 891 - 1018 = 1.000 ARTIFACT ASSOCIATION: N/A B-91780 B.P. 1790 ± 60 Janusek 2003:table 3.3, pp.142-144 DATA DESCRIPTION: Kirawi, Ck65 (N3970 E3980) L18, outdoor surface of structure 2 Associated with Late Formative 1 ceramics; none illustrated CALIB 5.0.2 RESULTS: PLOT GRAPH % area enclosed: relative area under probability distribution 68.3 (1 sigma) cal A.D. = 240 - 387 = 1.000 95.4 (2 sigma) cal A.D. = 132 - 425 = 1.000 ARTIFACT ASSOCIATION: N/A B-91777 B.P. 1630 ± 60 Janusek 2003:table 3.3, pp.142-144 DATA DESCRIPTION: Kirawi, Ck65 (N3970 E3970) L12, outdoor midden. Located below B91776. Associated with Late Formative 1 ceramics; none illustrated CALIB 5.0.2 RESULTS: PLOT GRAPH % area enclosed: relative area under probability distribution 68.3 (1 sigma) cal A.D. = 421 - 549 = 1.000 95.4 (2 sigma) cal A.D. = 344 - 373 = 0.028 cal A.D. = 376 - 613 = 0.972 ARTIFACT ASSOCIATION: N/A B-91776 B.P. 1490 ± 60 Janusek 2003:table 3.3, pp.142-144 DATA DESCRIPTION: Kirawi, Ck65 (N3970 E3970) L8, outdoor midden. Located above B91777. Associated with Late Formative 2 ceramics; none illustrated CALIB 5.0.2 RESULTS: PLOT GRAPH % area enclosed: relative area under probability distribution 68.3 (1 sigma) cal A.D. = 570 - 656 = 1.000 95.4 (2 sigma) cal A.D. = 435 - 491 = 0.055 cal A.D. = 508 - 518 = 0.007 cal A.D. = 528 - 688 = 0.936 cal A.D. = 754 - 757 = 0.002 ARTIFACT ASSOCIATION: N/A B-91778 B.P. 940 ± 40 Janusek 2003:table 3.3, p.151 DATA DESCRIPTION: Kirawi, Ck65 (N4002 E3994) F3, indoor main hearth. Associated with Tiwanaku V style ceramics; see Fig. 6.29 and 6.31 from burials CALIB 5.0.2 RESULTS: PLOT GRAPH % area enclosed: relative area under probability distribution 68.3 (1 sigma) cal A.D. = 1048 - 1081 = 0.331 cal A.D. = 1142 - 1207 = 0.669 95.4 (2 sigma) cal A.D. = 1041 - 1217 = 1.000 ARTIFACT ASSOCIATION: N/A SMU-2120 B.P. 1748 ± 254 Bermann (1990, 1994, 2003); Janusek (2003:Table 3.3) DATA DESCRIPTION: Lukurmata (N2886 E2855) L6; refuse near structure 13 Plainware, 1 Lorokea Fiber ware sherd and 2 Qeya sherds found; none illustrated Structure 13 located 45 m from main excavation. Probably represents Late Formative occupation. CALIB 5.0.2 RESULTS: PLOT GRAPH % area enclosed: relative area under probability distribution 68.3 (1 sigma) cal A.D. = 71 - 608 = 1.000 95.4 (2 sigma) cal BC = 350 - 305 = 0.010 cal A.D. = 209 - 877 = 0.990 ARTIFACT ASSOCIATION: N/A SMU-2118 B.P. 1619 ± 67 Bermann (1990, 1994, 2003); Janusek (2003:Table 3.3) DATA DESCRIPTION: Lukurmata (N2896 E2915) Mostly Lorokea Fiberware of Late Formative 1 and small sample of Tiwanaku III (Qeya). Probably represents Late Formative occupation. CALIB 5.0.2 RESULTS: PLOT GRAPH % area enclosed: relative area under probability distribution 68.3 (1 sigma) cal A.D. = 423 - 563 = 1.000 95.4 (2 sigma) cal A.D. = 347 - 369 = 0.022 cal A.D. = 378 - 639 = 0.978 ARTIFACT ASSOCIATION: N/A ETH-3177 B.P. 1340 ± 95 Bermann (1990, 1994, 2003); Janusek (2003:Table 3.3) DATA DESCRIPTION: Lukurmata (N 2888 E2929) L23; third floor of structure 29 Bermann (2003:Table 13.6) refers Structure 29 with structures 30-32 though the coordinates appear to be about 4 m to the east of the main excavation unit. Janusek refers to it as a "Late Formative 2 phase structure". No illustrated artifacts. CALIB 5.0.2 RESULTS: PLOT GRAPH % area enclosed: relative area under probability distribution 68.3 (1 sigma) cal A.D. = 656 - 784 = 0.744 cal A.D. = 787 - 826 = 0.167 cal A.D. = 841 - 862 = 0.089 95.4 (2 sigma) cal A.D. = 600 - 906 = 0.938 cal A.D. = 911 - 972 = 0.062 ARTIFACT ASSOCIATION: N/A SMU-2113 B.P. 1275 ± 218 Janusek (2003:Table 3.3) DATA DESCRIPTION: Lukurmata (N2884 E2913) F5, shallow pit in structure floor Structure is not referenced. Coordinates place it within the main excavation unit but depth and associations are unknown. No illustrated artifacts. Bermann did not publish this date. CALIB 5.0.2 RESULTS: PLOT GRAPH % area enclosed: relative area under probability distribution 68.3 (1 sigma) cal A.D. = 618 - 1024 = 1.000 95.4 (2 sigma) cal A.D. = 404 - 1229 = 0.999 cal A.D. = 1254 - 1257 = 0.001 ARTIFACT ASSOCIATION: N/A ETH-3179 (or ETH-3174) B.P. 1180 ± 80 Bermann (1990, 1994, 2003); Janusek (2003:Table 3.3) DATA DESCRIPTION: Lukurmata (N2890 E2821) F2, outdoor hearth west of structure 38 Bermann (1994:Fig.11.5) is upside down and represents the hand of a sitting human holding a "topo" as illustrated by Posnansky (1957, v.3-4: Plate XXII b,c,d) and Janusek (2004:Fig.3.76). Figure 11.5 is only illustration associated with the structure. Between this structure and SMU-2118 in Structure 16, there are no referenced dates or unreferenced structures with dates. Therefore, 300-400 years passed with what appears to be 4 occupational layers (Bermann 1994:Fig.1.4) and 100 cm. depth. Within one of these layers, Structure 19, were snuffing paraphernalia including a snuff tube fragment with fancy "fish" head motif iconography. With its association with Late Formative ceramics, Bermann (1994:134) suggests that "the representation of Tiwanaku iconography on various media may have been evolving at different rates." This piece may also represent the continuance of San Pedro de Atacama origins for a long tradition of hallucinogenic based cult behavior or "snuffing complex" (see Knobloch 2000b). CALIB 5.0.2 RESULTS: PLOT GRAPH % area enclosed: relative area under probability distribution 68.3 (1 sigma) cal A.D. = 782 - 789 = 0.027 cal A.D. = 812 - 847 = 0.156 cal A.D. = 855 - 991 = 0.817 95.4 (2 sigma) cal A.D. = 688 - 1035 = 1.000 ARTIFACT ASSOCIATION: Bermann 1994:Fig.11.5) ETH-3180 B.P. 990 ± 95 Bermann (1990, 1994, 2003); Janusek (2003:Table 3.3) DATA DESCRIPTION: Lukurmata (N2859 E3110) Ridge, N2859 E3110. L18, stratified refuse pit/hearth below Tiwanaku V outdoor surface. Exacavation located about 200 m east of main excavation (Bermann 1990:Fig.7 &11.9 maps). Located in Bennett's Section K area. Pottery was Tiwanaku V and similar to assemblage from the main excavation, structures 33-39. No level given for pottery locations (Bermann 1990:218-219, Figures 13.1-13.3). CALIB 5.0.2 RESULTS: PLOT GRAPH % area enclosed: relative area under probability distribution 68.3 (1 sigma) cal A.D. = 1018 - 1188 = 1.000 95.4 (2 sigma) cal A.D. = 899 - 919 = 0.019 cal A.D. = 949 - 1271 = 0.981 ARTIFACT ASSOCIATION: N/A ARTIFACT ASSOCIATION: N/A B-55490 B.P. 1290 ± 100 Janusek 1994:194-195; 2003:Table 3.3 DATA DESCRIPTION: Misiton I (N2342 E2970) First surface in workshop complex; context suggest LF 2 A small bone snuff tube fragment just above second surface. Not illustrated. CALIB 5.0.2 RESULTS: PLOT GRAPH % area enclosed: relative area under probability distribution 68.3 (1 sigma) cal A.D. = 684 - 885 = 1.000 95.4 (2 sigma) cal A.D. = 638 - 993 = 1.000 ARTIFACT ASSOCIATION: no illustrations published B-55487 B.P. 1110 ± 200 Janusek 1994; 2003:Table 3.3 DATA DESCRIPTION: Misiton I (N2342 E2962) Last surface in workshop patio. "Ceramic sherds from the final occupation still showed strong Tiwanaku IV period patterns." (Janusek 1994:ftnt.6, p.323) CALIB 5.0.2 RESULTS: PLOT GRAPH % area enclosed: relative area under probability distribution 68.3 (1 sigma) cal A.D. = 776 - 1161 = 1.000 95.4 (2 sigma) cal A.D. = 609 - 1298 = 1.000 ARTIFACT ASSOCIATION: Janusek 1994:Figures 8.19A, 8.26) SMU-1920 B.P. 1201 ± 96 Bermann 1990, 1994; Janusek 1994; 2003:Table 3.3 DATA DESCRIPTION: Misiton II (N2371 E2884) Hearth in circular structure. Bermann's structure #42. Oldest occupation area of complex. CALIB 5.0.2 RESULTS: PLOT GRAPH % area enclosed: relative area under probability distribution 68.3 (1 sigma) cal A.D. = 778 - 986 = 1.000 95.4 (2 sigma) cal A.D. = 664 - 1042 = 0.995 cal A.D. = 1091 - 1100 = 0.005 ARTIFACT ASSOCIATION: no ceramic illustrations SMU-2117 B.P. 1086 ± 60 Janusek 1994; 2003:Table 3.3 DATA DESCRIPTION: Misiton II (N2369 E2888) Outside hearth at backside of circular structure CALIB 5.0.2 RESULTS: PLOT GRAPH % area enclosed: relative area under probability distribution 68.3 (1 sigma) cal A.D. = 899 - 919 = 0.110 cal A.D. = 950 - 1045 = 0.801 cal A.D. = 1088 - 1105 = 0.089 95.4 (2 sigma) cal A.D. = 889 - 1151 = 1.000 ARTIFACT ASSOCIATION: no ceramic illustration B-55489 B.P. 840 ± 90 Janusek 1994:224; 2003:Table 3.3 DATA DESCRIPTION: Misiton II (N2361 E2888) Midden near storage complex, above surface, south side of Structure 2 Storage complex is later occupation than circular building. Tiwanaku style sherds illustrated in Janusek 1994:Fig.8.34 are without exact provenience to early or later sectors of complex. CALIB 5.0.2 RESULTS: PLOT GRAPH % area enclosed: relative area under probability distribution 68.3 (1 sigma) cal A.D. = 1055 - 1056 = 0.007 cal A.D. = 1151 - 1296 = 0.993 95.4 (2 sigma) cal A.D. = 1038 - 1320 = 0.942 cal A.D. = 1350 - 1385 = 0.058 ARTIFACT ASSOCIATION: N/A B-55488 B.P. 920 ± 70 Janusek 1994:233-234; 2003:Table 3.3 DATA DESCRIPTION: Misiton II (N2357 E2888) Hearth in late structure After a period of site abandonment, two large buildings were erected over the filled in storage complex. CALIB 5.0.2 RESULTS: PLOT GRAPH % area enclosed: relative area under probability distribution 68.3 (1 sigma) cal A.D. = 1046 - 1085 = 0.256 cal A.D. = 1110 - 1118 = 0.035 cal A.D. = 1131 - 1225 = 0.709 95.4 (2 sigma) cal A.D. = 1031 - 1270 = 1.000 B--Iwawi B.P. 720 ± 60 Isbell and Burkholder 2002:Fig. 7.10 DATA DESCRIPTION: Iwawi, Lake Titicaca southern shore (Loci 2165/15, 2422/3, 2171-1) Sample taken from soot scraped out of effigy vessel, Shape 5b or 'Incensario' located in a burial from Stratum IV that intruded into Stratum V. Puma style is defined by Burkholder (2001:232,236:Figs. 16,20) for this vessel and would be a substyle of Tiwanaku IV (Janusek 2003:71). CALIB 5.0.2 RESULTS: PLOT GRAPH % area enclosed: relative area under probability distribution 68.3 (1 sigma) cal A.D. = 776 - 899 = 0.827 cal A.D. = 919 - 950 = 0.173 95.4 (2 sigma) cal A.D. = 692 - 749 = 0.108 cal A.D. = 763 - 986 = 0.892 ARTIFACT ASSOCIATION: N/A ETH-6306 B.P. 1460 ± 60 Janusek 2003:Table 3.1; Alconini 1995:Fig.56 DATA DESCRIPTION: Akapana; Base of terrace 1 (N8026 E5030) Feature 17 offering with early ceramics CALIB 5.0.2 RESULTS: PLOT GRAPH % area enclosed: relative area under probability distribution 68.3 (1 sigma) cal A.D. = 584 - 670 = 1.000 95.4 (2 sigma) cal A.D. = 537 - 726 = 0.956 cal A.D. = 738 - 771 = 0.044 ARTIFACT ASSOCIATION: N/A SMU-2285 B.P. 1425 ± 211 Janusek 2003:Table 3.1; Alconini 1995:Fig.56 DATA DESCRIPTION: Akapana: Surface of terrace 1 (N8022 E5030) Feature 2 ceramic smash CALIB 5.0.2 RESULTS: PLOT GRAPH % area enclosed: relative area under probability distribution 68.3 (1 sigma) cal A.D. = 434 - 493 = 0.105 cal A.D. = 506 - 520 = 0.024 cal A.D. = 526 - 890 = 0.870 95.4 (2 sigma) cal A.D. = 230 - 1048 = 0.984 cal A.D. = 1081 - 1141 = 0.016 ARTIFACT ASSOCIATION: N/A SMU-2329 B.P. 1403 ± 211 Janusek 2003:Table 3.1; Alconini 1995:Fig.56 DATA DESCRIPTION: Akapana; Base of terrace 1. (N8030 E5424) Feature 16, human remains. CALIB 5.0.2 RESULTS: PLOT GRAPH % area enclosed: relative area under probability distribution 68.3 (1 sigma) cal A.D. = 440 - 485 = 0.068 cal A.D. = 532 - 898 = 0.891 cal A.D. = 920 - 944 = 0.041 95.4 (2 sigma) cal A.D. = 245 - 1050 = 0.979 cal A.D. = 1079 - 1145 = 0.021 ARTIFACT ASSOCIATION: N/A SMU-2468 B.P. 1392 ± 49 Janusek 2003:Table 3.1 DATA DESCRIPTION: Akapana; Summit. (N7982 E5008)[questionable location - not found within perimeters of any map] Feature 2, human remains. CALIB 5.0.2 RESULTS: PLOT GRAPH % area enclosed: relative area under probability distribution 68.3 (1 sigma) cal A.D. = 648 - 711 = 0.796 cal A.D. = 746 - 766 = 0.204 95.4 (2 sigma) cal A.D. = 604 - 779 = 0.993 cal A.D. = 794 - 802 = 0.007 ARTIFACT ASSOCIATION: N/A SMU-2293 B.P. 1388 ± 116 Janusek 2003:Table 3.1; Alconini 1995:Fig.56 DATA DESCRIPTION: Akapana; Surface of Terrace 1 (N8026 E5030) Feature 2 ceramic smash. CALIB 5.0.2 RESULTS: PLOT GRAPH % area enclosed: relative area under probability distribution 68.3 (1 sigma) cal A.D. = 602 - 783 = 0.839 cal A.D. = 788 - 822 = 0.107 cal A.D. = 842 - 860 = 0.054 95.4 (2 sigma) cal A.D. = 441 - 453 = 0.006 cal A.D. = 459 - 484 = 0.014 cal A.D. = 532 - 976 = 0.981 ARTIFACT ASSOCIATION: N/A ETH-5640 B.P. 1170 ± 65 Janusek 2003:Table 3.1; Alconini 1995:Fig.56 DATA DESCRIPTION: Akapana; Base of Terrace 1. (N8042 E5026) Feature 8, level 2a, 2 human burials with humans and camelids. Tiwanaku IV ceramics included a decorated kero (Manzanilla 1992:Fig.56). CALIB 5.0.2 RESULTS: PLOT GRAPH % area enclosed: relative area under probability distribution 68.3 (1 sigma) cal A.D. = 784 - 786 = 0.008 cal A.D. = 828 - 838 = 0.037 cal A.D. = 865 - 994 = 0.946 cal A.D. = 1009 - 1011 = 0.008 95.4 (2 sigma) cal A.D. = 723 - 740 = 0.013 cal A.D. = 770 - 1030 = 0.987 ARTIFACT ASSOCIATION: Manzanilla 1992:Figure 56 ETH-5639 B.P. 1170 ± 60 Janusek 2003:Table 3.1; DATA DESCRIPTION: Akapana; Surface of terrace 1. (N8026 E5030) Feature 11, human remains. CALIB 5.0.2 RESULTS: PLOT GRAPH % area enclosed: relative area under probability distribution 68.3 (1 sigma) cal A.D. = 833 - 835 = 0.008 cal A.D. = 868 - 994 = 0.992 95.4 (2 sigma) cal A.D. = 775 - 1024 = 1.000 ARTIFACT ASSOCIATION: N/A SMU-2367 B.P. 1152 ± 78 Janusek 2003:Table 3.1; DATA DESCRIPTION: Akapana; Base of terrace 1. (N7962 E4971) Feature 12, llama offering. CALIB 5.0.2 RESULTS: PLOT GRAPH % area enclosed: relative area under probability distribution 68.3 (1 sigma) cal A.D. = 830 - 836 = 0.025 cal A.D. = 867 - 1023 = 0.975 95.4 (2 sigma) cal A.D. = 717 - 744 = 0.020 cal A.D. = 768 - 1048 = 0.934 cal A.D. = 1082 - 1140 = 0.046 ARTIFACT ASSOCIATION: N/A SMU-2330 B.P. 1079 ± 109 Janusek 2003: Table 3.1; Kolata 2003:193; Alconini 1995:Fig.56 DATA DESCRIPTION: Akapana, Base of terrace 1 (N030 E5025) F13 canine offering Presence of burial indicates that the drainage system ceased. No ceramics. CALIB 5.0.2 RESULTS: PLOT GRAPH % area enclosed: relative area under probability distribution 68.3 (1 sigma) cal A.D. = 894 - 929 = 0.132 cal A.D. = 932 - 1053 = 0.552 cal A.D. = 1063 - 1068 = 0.016 cal A.D. = 1075 - 1149 = 0.299 95.4 (2 sigma) cal A.D. = 733 - 735 = 0.001 cal A.D. = 772 - 1223 = 0.999 ARTIFACT ASSOCIATION: N/A SMU-2473 B.P. 850 ± 243 Janusek 2003: Table 3.1; Kolata 2003:189; Alconini 1995:Fig.56 DATA DESCRIPTION: Akapana, summit (N8012 E5098) F11 with llama offerings. "time of general abandonment" and "sealing of room" (Kolata 2003:189) No ceramics Overlays major offeringof 14 llamas, miniature kero, complex polychrome pottery (including puma incensario and jar with staff deity). CALIB 5.0.2 RESULTS: PLOT GRAPH % area enclosed: relative area under probability distribution 68.3 (1 sigma) cal A.D. = 995 - 1008 = 0.024 cal A.D. = 1014 - 1398 = 0.976 95.4 (2 sigma) cal A.D. = 688 - 754 = 0.021 cal A.D. = 758 - 1511 = 0.961 cal A.D. = 1550 - 1559 = 0.002 cal A.D. = 1572 - 1622 = 0.016 ARTIFACT ASSOCIATION: N/A SMU-2336 B.P. 710 ± 110 Janusek 2003:Table 3.1; Alconini 1995:Fig.56 (conflict in publications, so this is Alconini's) DATA DESCRIPTION: Akapana; Summit. (N7944 E5074) Feature 19, U-shaped ritual structure. CALIB 5.0.2 RESULTS: PLOT GRAPH % area enclosed: relative area under probability distribution 68.3 (1 sigma) cal A.D. = 1236 - 1241 = 0.023 cal A.D. = 1265 - 1403 = 0.977 95.4 (2 sigma) cal A.D. = 1153 - 1452 = 1.000 ARTIFACT ASSOCIATION: N/A SMU-2333 B.P. 1716 ± 276 Janusek 1994; 2003:Table 3.1 DATA DESCRIPTION: Akapana East 1M, northern excavation (N7868 E5362) R.3, infant burial, possibly intrusive into wall CALIB 5.0.2 RESULTS: PLOT GRAPH % area enclosed: relative area under probability distribution 68.3 (1 sigma) cal A.D. = 72 - 651 = 1.000 95.4 (2 sigma) cal BC = 352 - 296 = 0.013 cal BC = 228 - 220 = 0.002 cal BC = 211 - ad 900 = 0.976 cal A.D. = 918 - 962 = 0.009 ARTIFACT ASSOCIATION: No illustrated ceramics B-55491 B.P. 1500 ± 100 Janusek 1994:134; 2003:Table 3.1 DATA DESCRIPTION: Akapana East 1M, southern excavation (N7854 E5350) Second patio floor, structure 1 One of 10 levels/floors excavated in Patio area. Below, on first floor are Tiwanaku ceramics (Janusek 1994:Fig.7.11A, B). CALIB 5.0.2 RESULTS: PLOT GRAPH % area enclosed: relative area under probability distribution 68.3 (1 sigma) cal A.D. = 440 - 485 = 0.142 cal A.D. = 532 - 674 = 0.858 95.4 (2 sigma) cal A.D. = 387 - 780 = 0.995 cal A.D. = 792 - 804 = 0.005 ARTIFACT ASSOCIATION: Janusek 1994:Fig.7.11C, D SMU-2332 B.P. 1017 ± 115 Janusek 1994:377; 2003:Table 3.1 DATA DESCRIPTION: Akapana East 1M, northern excavation (N7870 E5356) R3 small pit or post hole or refuse pit. CALIB 5.0.2 RESULTS: PLOT GRAPH % area enclosed: relative area under probability distribution 68.3 (1 sigma) cal A.D. = 985 - 1190 = 0.974 cal A.D. = 1193 - 1202 = 0.026 95.4 (2 sigma) cal A.D. = 783 - 787 = 0.002 cal A.D. = 822 - 842 = 0.011 cal A.D. = 861 - 1278 = 0.987 ARTIFACT ASSOCIATION: No illustrated ceramics SMU-2331 B.P. 872 ± 197 Janusek 1994:377; 2003:Table 3.1 DATA DESCRIPTION: Akapana East 1M, between southern & northern excavations (N7860 E5362) Level 6, ash deposit; east of Structure 4 These coordinates may be wrong or come from an unpublished excavation. CALIB 5.0.2 RESULTS: PLOT GRAPH % area enclosed: relative area under probability distribution 68.3 (1 sigma) cal A.D. = 1021 - 1316 = 0.934 cal A.D. = 1355 - 1382 = 0.066 95.4 (2 sigma) cal A.D. = 779 - 795 = 0.006 cal A.D. = 798 - 1450 = 0.994 ARTIFACT ASSOCIATION: No illustrated ceramics SMU-2471 B.P. 1428 ± 99 Janusek 1994:107; 2003:Table 3.1 DATA DESCRIPTION: Akapana East 1 (N7857 E5432) Level 3B, burned area on mound over ritual structures "Ömarks the end of the occupation" (IBID:108), but not clear what the last occupation relates to culturally, Late Formative ? LF/E Tiw.IV? CALIB 5.0.2 RESULTS: PLOT GRAPH % area enclosed: relative area under probability distribution 68.3 (1 sigma) cal A.D. = 573 - 730 = 0.837 cal A.D. = 736 - 772 = 0.163 95.4 (2 sigma) cal A.D. = 435 - 491 = 0.043 cal A.D. = 508 - 518 = 0.007 cal A.D. = 527 - 887 = 0.950 ARTIFACT ASSOCIATION: No published illustrations SMU-2469 B.P. 1191 ± 101 Janusek 1994:302; 2003:Table 3.1 DATA DESCRIPTION: Akapana East 1, Southern Compound (N7855 E5426) South compound, outside structure 1's northeast corner, Level 2 In patio area and associated with SMU-2276-2277, 2289-2290. Associated with Tiwanaku V style ceramics and snuff tube. CALIB 5.0.2 RESULTS: PLOT GRAPH % area enclosed: relative area under probability distribution 68.3 (1 sigma) cal A.D. = 778 - 990 = 1.000 95.4 (2 sigma) cal A.D. = 669 - 1046 = 0.977 cal A.D. = 1086 - 1109 = 0.016 cal A.D. = 1119 - 1130 = 0.007 ARTIFACT ASSOCIATION: Janusek 1994:Fig.10.18, Snuff tube Janusek 1994:Fig.10.22 C, D; 10.23, Keros ARTIFACT ASSOCIATION: Janusek 1994:Fig.10.22 A, B, Escudillas Janusek 1994:Fig.10.25 SMU-2276 B.P. 1073 ± 57 Janusek 2003:Table 3.1 DATA DESCRIPTION: Akapana East 1, Southern Compound (N7860 E5424) F1, hearth in patio area Associated with Tiwanaku V style ceramics and snuff tube. CALIB 5.0.2 RESULTS: PLOT GRAPH % area enclosed: relative area under probability distribution 68.3 (1 sigma) cal A.D. = 974 - 1046 = 0.719 cal A.D. = 1084 - 1133 = 0.281 95.4 (2 sigma) cal A.D. = 895 - 926 = 0.080 cal A.D. = 935 - 1152 = 0.920 ARTIFACT ASSOCIATION: Janusek 1994:Fig.10.18, Snuff tube Janusek 1994:Fig.10.22 C, D; 10.23, Keros ARTIFACT ASSOCIATION: Janusek 1994:Fig.10.22 A, B, Escudillas Janusek 1994:Fig.10.25 SMU-2277 B.P. 1134 ± 60 Janusek 2003:Table 3.1 DATA DESCRIPTION: Akapana East 1, Southern Compound (N7862 E5424) F3, ash pit in patio area Associated with Tiwanaku V style ceramics and snuff tube. CALIB 5.0.2 RESULTS: PLOT GRAPH % area enclosed: relative area under probability distribution 68.3 (1 sigma) cal A.D. = 895 - 925 = 0.276 cal A.D. = 936 - 1017 = 0.724 95.4 (2 sigma) cal A.D. = 779 - 795 = 0.017 cal A.D. = 797 - 1045 = 0.969 cal A.D. = 1087 - 1105 = 0.015 ARTIFACT ASSOCIATION: Janusek 1994:Fig.10.18, Snuff tube Janusek 1994:Fig.10.22 C, D; 10.23, Keros ARTIFACT ASSOCIATION: Janusek 1994:Fig.10.22 A, B, Escudillas Janusek 1994:Fig.10.25 SMU-2289 B.P. 1185 ± 56 Janusek 2003:Table 3.1 DATA DESCRIPTION: Akapana East 1, Southern Compound (N7860 E5424) F3 hearth/refuse pit in patio area Associated with Tiwanaku V style ceramics and snuff tube. CALIB 5.0.2 RESULTS: PLOT GRAPH % area enclosed: relative area under probability distribution 68.3 (1 sigma) cal A.D. = 784 - 786 = 0.005 cal A.D. = 829 - 837 = 0.044 cal A.D. = 865 - 987 = 0.951 95.4 (2 sigma) cal A.D. = 774 - 1018 = 1.000 ARTIFACT ASSOCIATION: Janusek 1994:Fig.10.18, Snuff tube Janusek 1994:Fig.10.22 C, D; 10.23, Keros ARTIFACT ASSOCIATION: Janusek 1994:Fig.10.22 A, B, Escudillas Janusek 1994:Fig.10.25 SMU-2290 B.P. 1121 ± 74 Janusek 2003: Table 3.1 DATA DESCRIPTION: Akapana East 1, Southern Compound (N7860 E5430) F1, hearth in patio area Associated with Tiwanaku V style ceramics and snuff tube. CALIB 5.0.2 RESULTS: PLOT GRAPH % area enclosed: relative area under probability distribution 68.3 (1 sigma) cal A.D. = 886 - 1033 = 1.000 95.4 (2 sigma) cal A.D. = 778 - 1052 = 0.893 cal A.D. = 1076 - 1148 = 0.107 ARTIFACT ASSOCIATION: Janusek 1994:Fig.10.18, Snuff tube Janusek 1994:Fig.10.22 C, D; 10.23, Keros ARTIFACT ASSOCIATION: Janusek 1994:Fig.10.22 A, B, Escudillas Janusek 1994:Fig.10.25 SMU-2470 B.P. 632 ± 183 Janusek 2003: Table 3.1; 1994:377 DATA DESCRIPTION: Akapana East 1, canal sector (N7857 E5426) F1, ashpit above structure 2 that was abandoned and filled No discussion or illustrations of ceramics. CALIB 5.0.2 RESULTS: PLOT GRAPH % area enclosed: relative area under probability distribution 68.3 (1 sigma) cal A.D. = 1217 - 1499 = 0.980 cal A.D. = 1599 - 1609 = 0.020 95.4 (2 sigma) cal A.D. = 1027 - 1670 = 0.995 cal A.D. = 1749 - 1751 = 0.001 cal A.D. = 1782 - 1795 = 0.004 ARTIFACT ASSOCIATION: N/A OS-11306 B.P. 1560 ± 25 Janusek 2003:Table 3.1; Couture & Sampeck 2003:230-231 DATA DESCRIPTION: Putuni, red clay platform structure below Palace's later platform extension (N8109 E4858)* a secondary deposition associated with domestic wares, sahumador & escudilla sherds including a burnished, tan ("tan" and "beige" are used interchangeably between text and figures) escudilla rim sherd with vertical bands. Though not illustrated, Janusek (2003:65-66) describes similar vessels as appearing in Late Formative 2 /Early Tiwanaku IV with two subvariants. The earlier subvariant was illustrated (Janusek 2003:Figure 3.49) and is presumably Late Formative 2 and matches the description above. It is adopted from Alconiniís ìAkapana Aî phase or ìearlyî Tiwanaku IV (Alconini 1995:78-79, Figure 60). Of the 307 sherds found on the platformís surface, 54 were serving ware and 8 were from decorated sahumadors (Couture 2002:Tables 4.1-4.3). Though the serving ware may have included more examples of iconography, only one everted bowl fragment was illustrated (Couture and Sampeck 2003:Figure 9.8). * I believe the N coordinates of OS11306 and OS10643 were transposed in the text. CALIB 5.0.2 RESULTS: PLOT GRAPH % area enclosed: relative area under probability distribution 68.3 (1 sigma) cal A.D. = 542 - 598 = 1.000 95.4 (2 sigma) cal A.D. = 438 - 487 = 0.104 cal A.D. = 531 - 636 = 0.896 ARTIFACT ASSOCIATION: Fig. D = Couture and Sampeck 2003:Figure 9.8 SMU-2369 B.P. 1360 ± 155 Janusek 2003:Table 3.1; Couture & Sampeck 2003:158 DATA DESCRIPTION: Putuni, under north wall (N8145 E4869) secondary deposition under northwest corner of Palace wall. Associated with two refuse pits but no description or illustrations of cultural material. Supports a post 600 A.D. construction date for Putuni Palace. CALIB 5.0.2 RESULTS: PLOT GRAPH % area enclosed: relative area under probability distribution 68.3 (1 sigma) cal A.D. = 599 - 894 = 0.989 cal A.D. = 928 - 933 = 0.011 95.4 (2 sigma) cal A.D. = 424 - 1025 = 1.000 ARTIFACT ASSOCIATION: No published illustrations OS-10643 B.P. 1230 ± 40 Janusek 2003:Table 3.1; Couture & Sampeck 2003:234 DATA DESCRIPTION: Putuni; kitchen complex (N8129 E4858)* A primary deposition associated with the kitchen floor and nearby ash pits and cooking hearths. Below "Palace of the MultiColored Rooms". From Tables 5.3-5.5 (Couture 2002), over 5,000 sherds were found including over 500 decorated storage vessels and over 500 serving vessels. Illustrations only display 6 plainware storage vessels and 2 escudillas similar to the one described from the red clay platform structure. * I believe the N coordinates of OS11306 and OS10643 were transposed in the text. CALIB 5.0.2 RESULTS: PLOT GRAPH % area enclosed: relative area under probability distribution 68.3 (1 sigma) cal A.D. = 779 - 794 = 0.127 cal A.D. = 800 - 895 = 0.818 cal A.D. = 927 - 935 = 0.055 95.4 (2 sigma) cal A.D. = 722 - 740 = 0.027 cal A.D. = 770 - 977 = 0.973 ARTIFACT ASSOCIATION: Figs. A,B,C = Couture and Sampeck 2003:Figure 9.13 SMU-2472 B.P. 1197 ± 115 Janusek 2003:Table 3.1; Couture & Sampeck 2003:251 DATA DESCRIPTION: Putuni Palace (N8129 E4862) carbonized wood from roof beam or strut The burned roof was covered with adobe bricks indicating a razed and abandoned structure. CALIB 5.0.2 RESULTS: PLOT GRAPH % area enclosed: relative area under probability distribution 68.3 (1 sigma) cal A.D. = 732 - 735 = 0.012 cal A.D. = 772 - 996 = 0.960 cal A.D. = 1006 - 1015 = 0.028 95.4 (2 sigma) cal A.D. = 660 - 1048 = 0.954 cal A.D. = 1081 - 1141 = 0.046 ARTIFACT ASSOCIATION: No published illustrations SMU-2465 B.P. 1105 ± 53 Janusek 2003:Table 3.1; Couture & Sampeck 2003:255 DATA DESCRIPTION: Putuni Palace (N8129 E4862) subfloor tomb, F18. After Palace construction. Large decorated tinaja and 8 other tazones not illustrated. CALIB 5.0.2 RESULTS: PLOT GRAPH % area enclosed: relative area under probability distribution 68.3 (1 sigma) cal A.D. = 899 - 919 = 0.172 cal A.D. = 949 - 1028 = 0.828 95.4 (2 sigma) cal A.D. = 881 - 1050 = 0.910 cal A.D. = 1079 - 1144 = 0.090 ARTIFACT ASSOCIATION: Janusek 1994:Fig.10.3; Couture & Sampeck 2003:9.44 SMU-2466 B.P. 1174 ± 59 Janusek 2003:Table 3.1; Couture & Sampeck 2003:255 DATA DESCRIPTION: Putuni Palace (N8129 E4862) subfloor tomb, F18. After Palace construction. Large decorated tinaja and 8 other tazones not illustrated. CALIB 5.0.2 RESULTS: PLOT GRAPH % area enclosed: relative area under probability distribution 68.3 (1 sigma) cal A.D. = 831 - 836 = 0.017 cal A.D. = 867 - 992 = 0.983 95.4 (2 sigma) cal A.D. = 775 - 1022 = 1.000 ARTIFACT ASSOCIATION: Janusek 1994:Fig.10.3; Couture & Sampeck 2003:9.44 SMU-2467 B.P. 1132 ± 61 Janusek 2003:Table 3.1; Couture & Sampeck 2003:255 DATA DESCRIPTION: Putuni Palace (N8129 E4862) subfloor tomb, F18. After Palace construction. Large decorated tinaja and 8 other tazones not illustrated. CALIB 5.0.2 RESULTS: PLOT GRAPH % area enclosed: relative area under probability distribution 68.3 (1 sigma) cal A.D. = 895 - 926 = 0.271 cal A.D. = 935 - 1019 = 0.729 95.4 (2 sigma) cal A.D. = 779 - 794 = 0.015 cal A.D. = 800 - 1045 = 0.959 cal A.D. = 1086 - 1108 = 0.019 cal A.D. = 1120 - 1129 = 0.007 ARTIFACT ASSOCIATION: Janusek 1994:Fig.10.3; Couture & Sampeck 2003:9.44 |
| B-36639 B.P. 1470 ± 70 Goldstein & Owen 2002:Tabla 1; Owen & Goldstein 2002:Tabla 1 DATA DESCRIPTION: Omo M12 Structure 2, post M12=1617. Wood sample. Omo style. (Goldstein 1993:31) CALIB 5.0.2 RESULTS: PLOT GRAPH % area enclosed: relative area under probability distribution 68.3 (1 sigma) cal A.D. = 565 - 670 = 1.000 95.4 (2 sigma) cal A.D. = 437 - 488 = 0.047 cal A.D. = 530 - 731 = 0.905 ARTIFACT ASSOCIATION: N/A B-129938 B.P. 1290 ± 70 Goldstein & Owen 2002:Tabla 1 DATA DESCRIPTION: Omo Alto M16 Tomb 15, post M16=5500. Wood sample. Omo style. CALIB 5.0.2 RESULTS: PLOT GRAPH % area enclosed: relative area under probability distribution 68.3 (1 sigma) cal A.D. = 692 - 749 = 0.345 cal A.D. = 763 - 873 = 0.655 95.4 (2 sigma) cal A.D. = 659 - 901 = 0.931 cal A.D. = 917- 963 = 0.069 ARTIFACT ASSOCIATION: N/A B-134693 B.P. 1180 ± 80 Goldstein & Owen 2002:Tabla 1; Owen & Goldstein 2002:Tabla 1 DATA DESCRIPTION: La Cantera Unit 85, fill in hole, wood carbon sample. Omo style. CALIB 5.0.2 RESULTS: PLOT GRAPH % area enclosed: relative area under probability distribution 68.3 (1 sigma) cal A.D. = 782 - 789 = 0.027 cal A.D. = 812 - 847 = 0.156 cal A.D. = 855 - 991 = 0.817 95.4 (2 sigma) cal A.D. = 688 - 1035 = 1.000 ARTIFACT ASSOCIATION: N/A B-129939 B.P. 1160 ± 60 Goldstein & Owen 2002:Tabla 1; Owen & Goldstein 2002:Tabla 1 DATA DESCRIPTION: Rio Muerto M70 Wood sample. Omo style. (Magilligan and Goldstein 2001: 433). CALIB 5.0.2 RESULTS: PLOT GRAPH % area enclosed: relative area under probability distribution 68.3 (1 sigma) cal A.D. = 882 - 995 = 0.961 cal A.D. = 1007 - 1015 = 0.039 95.4 (2 sigma) cal A.D. = 777 - 1027 = 1.000 ARTIFACT ASSOCIATION: N/A AA-38032 B.P. 1132 ± 39 Goldstein & Owen 2002:Tabla 1 DATA DESCRIPTION: Rio Muerto M70 Post of structure M70=1245. Wood sample. Omo style. CALIB 5.0.2 RESULTS: PLOT GRAPH % area enclosed: relative area under probability distribution 68.3 (1 sigma) cal A.D. = 898 - 920 = 0.280 cal A.D. = 945 - 995 = 0.650 cal A.D. = 1007 - 1015 = 0.070 95.4 (2 sigma) cal A.D. = 890 - 1023 = 1.000 ARTIFACT ASSOCIATION: N/A B-127211 B.P. 1080 ± 70 Goldstein & Owen 2002:Tabla 1; Owen & Goldstein 2002:Tabla 1 DATA DESCRIPTION: La Cantera Unit 82, fill in hole. Wood carbon sample. Omo style. CALIB 5.0.2 RESULTS: PLOT GRAPH % area enclosed: relative area under probability distribution 68.3 (1 sigma) cal A.D. = 900 - 918 = 0.097 cal A.D. = 962 - 1047 = 0.643 cal A.D. = 1083 - 1136 = 0.260 95.4 (2 sigma) cal A.D. = 874 - 1180 = 1.000 ARTIFACT ASSOCIATION: N/A B-120264 B.P. 1060 ± 70 Goldstein & Owen 2002:Tabla 1; Owen & Goldstein 2002:Tabla 1 DATA DESCRIPTION: Omo M12 Structure 7, post M12=3016. Wood sample. Omo style. CALIB 5.0.2 RESULTS: PLOT GRAPH % area enclosed: relative area under probability distribution 68.3 (1 sigma) cal A.D. = 977 - 1052 = 0.570 cal A.D. = 1077 - 1147 = 0.430 95.4 (2 sigma) cal A.D. = 892 - 1179 = 1.000 ARTIFACT ASSOCIATION: N/A B-60762 B.P. 1040 ± 70 Goldstein & Owen 2002:Tabla 1; Owen & Goldstein 2002:Tabla 1 DATA DESCRIPTION: Omo M12 Structure 7, post M12=3388. Wood sample. Omo style CALIB 5.0.2 RESULTS: PLOT GRAPH % area enclosed: relative area under probability distribution 68.3 (1 sigma) cal A.D. = 989 - 1052 = 0.479 cal A.D. = 1076 - 1148 = 0.521 95.4 (2 sigma) cal A.D. = 897 - 921 = 0.035 cal A.D. = 943 - 1202 = 0.965 ARTIFACT ASSOCIATION: N/A B-39679 B.P. 1160 ± 50 Goldstein & Owen 2002:Tabla 1; Owen & Goldstein 2002:Tabla 1 DATA DESCRIPTION: Omo M10 Door lintel to the temple structure. Wood sample. Chen Chen style. (Goldstein 1993:34). CALIB 5.0.2 RESULTS: PLOT GRAPH % area enclosed: relative area under probability distribution 68.3 (1 sigma) cal A.D. = 892 - 988 = 1.000 95.4 (2 sigma) cal A.D. = 782 - 790 = 0.013 cal A.D. = 810 - 1021 = 0.987 ARTIFACT ASSOCIATION: N/A AA-37175 B.P. 1175 ± 32 Goldstein & Owen 2002:Tabla 1; Owen & Goldstein 2002:Tabla 1 DATA DESCRIPTION: Chen Chen Tomb M1(95)=1308. Camelid wool from textile. Chen Chen style. CALIB 5.0.2 RESULTS: PLOT GRAPH % area enclosed: relative area under probability distribution 68.3 (1 sigma) cal A.D. = 894 - 905 = 0.147 cal A.D. = 911 - 973 = 0.853 95.4 (2 sigma) cal A.D. = 783 - 787 = 0.005 cal A.D. = 815 - 842 = 0.032 cal A.D. = 861 - 992 = 0.963 ARTIFACT ASSOCIATION: N/A B-26650 B.P. 1120 ± 60 Goldstein & Owen 2002:Tabla 1; Owen & Goldstein 2002:Tabla 1 DATA DESCRIPTION: Omo M10 Sructure 13, post. Wood sample. Chen Chen style. (Goldstein 1989: 69). CALIB 5.0.2 RESULTS: PLOT GRAPH % area enclosed: relative area under probability distribution 68.3 (1 sigma) cal A.D. = 896 - 923 = 0.228 cal A.D. = 939 - 1023 = 0.772 95.4 (2 sigma) cal A.D. = 782 - 789 = 0.005 cal A.D. = 811 - 847 = 0.031 cal A.D. = 856 - 1048 = 0.899 cal A.D. = 1082 - 1140 = 0.065 ARTIFACT ASSOCIATION: N/A B-129619 B.P. 1120 ± 50 Goldstein & Owen 2002:Tabla 1; Owen & Goldstein 2002:Tabla 1 DATA DESCRIPTION: Cancha de Yacango Locus 32-21, garbage/midden. Wood carbon sample. Chen Chen style. CALIB 5.0.2 RESULTS: PLOT GRAPH % area enclosed: relative area under probability distribution 68.3 (1 sigma) cal A.D. = 899 - 919 = 0.204 cal A.D. = 949 - 1020 = 0.796 95.4 (2 sigma) cal A.D. = 832 - 836 = 0.002 cal A.D. = 867 - 1046 = 0.969 cal A.D. = 1085 - 1111 = 0.020 cal A.D. = 1117 - 1132 = 0.009 ARTIFACT ASSOCIATION: N/A AA-38031 B.P. 1122 ± 44 Goldstein & Owen 2002:Tabla 1 DATA DESCRIPTION: Rio Muerto M43 Post M43=1067. Wood sample. Chen Chen style. CALIB 5.0.2 RESULTS: PLOT GRAPH % area enclosed: relative area under probability distribution 68.3 (1 sigma) cal A.D. = 899 - 919 = 0.216 cal A.D. = 953 - 957 = 0.037 cal A.D. = 961 - 1019 = 0.747 95.4 (2 sigma) cal A.D. = 880 - 1040 = 1.000 ARTIFACT ASSOCIATION: N/A B-134694 B.P. 1090 ± 70 Goldstein & Owen 2002:Tabla 1; Owen & Goldstein 2002:Tabla 1 DATA DESCRIPTION: Cancha de Yacango Locus 17-25, garbage/midden. Wood carbon sample. Chen Chen style. CALIB 5.0.2 RESULTS: PLOT GRAPH % area enclosed: relative area under probability distribution 68.3 (1 sigma) cal A.D. = 897 - 922 = 0.144 cal A.D. = 940 - 1045 = 0.747 cal A.D. = 1087 - 1107 = 0.092 cal A.D. = 1123 - 1127 = 0.017 95.4 (2 sigma) cal A.D. = 784 - 787 = 0.002 cal A.D. = 826 - 841 = 0.009 cal A.D. = 862 - 1162 = 0.987 cal A.D. = 1170 - 1174 = 0.003 ARTIFACT ASSOCIATION: N/A AA-37173 B.P. 1092 ± 52 Goldstein & Owen 2002:Tabla 1; Owen & Goldstein 2002:Tabla 1 DATA DESCRIPTION: Chen Chen Tomb M1(95)=1220. Camelid wool from textile. Chen Chen style. CALIB 5.0.2 RESULTS: PLOT GRAPH % area enclosed: relative area under probability distribution 68.3 (1 sigma) cal A.D. = 899 - 919 = 0.127 cal A.D. = 951 - 957 = 0.030 cal A.D. = 960 - 1038 = 0.843 95.4 (2 sigma) cal A.D. = 890 - 1050 = 0.858 cal A.D. = 1079 - 1145 = 0.142 ARTIFACT ASSOCIATION: N/A AA-40628 B.P. 1101 ± 35 Goldstein & Owen 2002:Tabla 1; Owen & Goldstein 2002:Tabla 1 DATA DESCRIPTION: Omo M10 Structure 11, Post M10-1121. Wood sample. Chen Chen style. CALIB 5.0.2 RESULTS: PLOT GRAPH % area enclosed: relative area under probability distribution 68.3 (1 sigma) cal A.D. = 974 - 1025 = 1.000 95.4 (2 sigma) cal A.D. = 895 - 927 = 0.129 cal A.D. = 935 - 1036 = 0.871 ARTIFACT ASSOCIATION: N/A B-51065 B.P. 1050 ± 60 Owen & Goldstein 2002:Tabla 1 DATA DESCRIPTION: El Algodonal Tomb 383. Textil AD 383-1-1.10. Camelid wool from textile. Tumilaca style. (Owen 1993:408). CALIB 5.0.2 RESULTS: PLOT GRAPH % area enclosed: relative area under probability distribution 68.3 (1 sigma) cal A.D. = 988 - 1048 = 0.548 cal A.D. = 1081 - 1141 = 0.452 95.4 (2 sigma) cal A.D. = 898 - 920 = 0.033 cal A.D. = 946 - 1177 = 0.967 ARTIFACT ASSOCIATION: N/A B-51061 B.P. 1040 ± 60 Owen & Goldstein 2002:Tabla 1 DATA DESCRIPTION: El Algodonal Tomb 363, textile AD 363.05. Camelid wool from textile. Tumilaca style. (Owen 1993:408). CALIB 5.0.2 RESULTS: PLOT GRAPH % area enclosed: relative area under probability distribution 68.3 (1 sigma) cal A.D. = 992 - 1049 = 0.488 cal A.D. = 1080 - 1143 = 0.512 95.4 (2 sigma) cal A.D. = 899 - 919 = 0.023 cal A.D. = 953 - 956 = 0.002 cal A.D. = 961 - 1184 = 0.975 ARTIFACT ASSOCIATION: N/A AA-37150 B.P. 1021 ± 39 Owen & Goldstein 2002:Tabla 1 DATA DESCRIPTION: El Algodonal Tomb 334, textile AD 334.01. Camelid wool from textile. Tumilaca style. CALIB 5.0.2 RESULTS: PLOT GRAPH % area enclosed: relative area under probability distribution 68.3 (1 sigma) cal A.D. = 1023 - 1048 = 0.322 cal A.D. = 1082 - 1141 = 0.678 95.4 (2 sigma) cal A.D. = 994 - 1153 = 1.000 ARTIFACT ASSOCIATION: N/A B-51068 B.P. 1020 ± 80 Owen & Goldstein 2002:Tabla 1 DATA DESCRIPTION: El Algodonal Post AD 525-15-11/1. Wood sample. Tumilaca style. (Owen 1993: 407). CALIB 5.0.2 RESULTS: PLOT GRAPH % area enclosed: relative area under probability distribution 68.3 (1 sigma) cal A.D. = 995 - 1007 = 0.060 cal A.D. = 1015 - 1153 = 0.940 95.4 (2 sigma) cal A.D. = 897 - 922 = 0.028 cal A.D. = 941 - 1221 = 0.972 ARTIFACT ASSOCIATION: N/A B-51070 B.P. 990 ± 50 Owen & Goldstein 2002:Tabla 1 DATA DESCRIPTION: Loreto Alto Firepit LA1518-2-2. Carbon wood sample. Tumilaca style. (Owen 1993: 407). CALIB 5.0.2 RESULTS: PLOT GRAPH % area enclosed: relative area under probability distribution 68.3 (1 sigma) cal A.D. = 1035 - 1053 = 0.174 cal A.D. = 1062 - 1150 = 0.826 95.4 (2 sigma) cal A.D. = 1016 - 1207 = 1.000 ARTIFACT ASSOCIATION: N/A B-51072 B.P. 950 ± 80 Owen & Goldstein 2002:Tabla 1 DATA DESCRIPTION: Loreto Alto Wall trench LA 1530-5-4. Wood twigs sample. Tumilaca style. (Owen 1993: 407). CALIB 5.0.2 RESULTS: PLOT GRAPH % area enclosed: relative area under probability distribution 68.3 (1 sigma) cal A.D. = 1043 - 1090 = 0.315 cal A.D. = 1102 - 1207 = 0.685 95.4 (2 sigma) cal A.D. = 995 - 1007 = 0.014 cal A.D. = 1015 - 1270 = 0.986 ARTIFACT ASSOCIATION: N/A B-51069 B.P. 810 ± 60 Owen & Goldstein 2002:Tabla 1 DATA DESCRIPTION: Loreto Alto Garbage/midden LA 1506-5-2. Wood twigs sample. Tumilaca style. (Owen 1993: 407). CALIB 5.0.2 RESULTS: PLOT GRAPH % area enclosed: relative area under probability distribution 68.3 (1 sigma) cal A.D. = 1213 - 1290 = 1.000 95.4 (2 sigma) cal A.D. = 1156 - 1318 = 0.939 cal A.D. = 1353 - 1384 = 0.061 ARTIFACT ASSOCIATION: N/A Caserones C-14 CHART CAMS-7604 Oakland 2000:Fig. 12.8 DATA DESCRIPTION: Caserones striped and knotted headdress from House 17, Unit 1 Collection of the Department of Anthropology, UC-Davis CALIB RESULTS N/A ARTIFACT ASSOCIATION: N/A B-63793 Oakland 2000:Fig. 12.14 DATA DESCRIPTION: Caserones Alto Ramirez-style warp-faced, striped camelid-fiber shirt from late cemetery Tr-40B, Tomb 3, Section M. Covered Tiwanaku tapestry tunic in Fig. 12.15 (See Young-Sanchez 2004:Fig. 2. 29 for similar tunic). Collection of the Museo AntropolÛgico Arturo Prat, Iquique. CALIB RESULTS N/A ARTIFACT ASSOCIATION: N/A CAMS-7607 Oakland 2000:Fig. 12.16 DATA DESCRIPTION: Caserones Tiwanaku embroidered tunic from the late cemetery Tr-40B, Tomb 3, section SS Collection of the Museo AntropolÛgico Arturo Prat, Iquique. CALIB RESULTS N/A ARTIFACT ASSOCIATION: Fig. 12.16 CAMS-7608 Oakland 2000:Fig. 12.17 DATA DESCRIPTION: Caserones Tiwanaku embroidered tunic from the late cemetery Tr-40B, Tomb 5, section SS Collection of the Museo AntropolÛgico Arturo Prat, Iquique. CALIB RESULTS N/A ARTIFACT ASSOCIATION: Fig. 12.17 DATA DESCRIPTION: CALIB RESULTS N/A ARTIFACT ASSOCIATION: N/A BACK TO TOP |